Sections
Please use the links below to jump to specific sections in the State of the District 2024 webpage.
Introduction
This state of the district report aligns with Rother District Council’s emerging Corporate Plan priority areas of Our People and Our Place.
This report provides information relating to the Rother district, such as demography, compiled from the most recent census in 2021. The report provides the evidence base for the Council to monitor its progress against the objectives it will set itself in the emerging Corporate Plan and to identify emerging issues and opportunities.
Overview
The Rother district covers an area of 200 square miles, a diverse geographical area that includes coastal towns, rural villages, and the High Weald National Landscape.
It benefits from a blend of some of the most beautiful countryside and coastline in Southeast England and contains the historic market towns of Battle and Rye, the Victorian/Edwardian seaside town (and administrative centre) of Bexhill and many picturesque villages.
Its population of 93,100 (Census 2021) is divided almost equally between Bexhill-on-Sea and the rural surrounding area. 83% of Rother is in the High Weald National Landscape (formerly known as Area of Outstanding Natural Beauty) and there are many important sites for nature.
Although not a wealthy area relative to other more affluent parts of the Southeast, Rother is an attractive and safe place to live. However, despite the district having several positive attributes, the district also has some big challenges, increasing affordable housing supply responding to environmental change, supporting economic growth and decent jobs, and tackling deprivation.
Overall, Rother is a diverse and historically rich area with a mix of urban and rural landscapes, offering residents and visitors a range of amenities and attractions.
Figure 1: The Rother District
Our People
Population
Between the last two censuses (held in 2011 and 2021), the population of Rother increased by 2.8%, from just under 90,600 in 2011 to around 93,100 in 2021. This compares to a 7.5% South East average and 6.6% nationally, with residents dispersed across the rural area, but with half living in Bexhill.
The average (median) age of Rother increased by three years, from 50 to 53 years of age. The area had the highest average (median) age in the Southeast and a higher average (median) age than England (40 years).
An analysis of Rother’s age demography shows that 51% are of working-age. People under the age of 16 represent 17% of the population and over 65s represent 33% of the population (Figure 2).
The number of people aged 65 to 74 rose by just over 2,900 (an increase of 23.8%), while the number of residents between 35 and 49 fell by around 3,200 (19.3% decrease). The proportion of people aged 65 years and over in Rother, especially in parts of Bexhill is predicted to increase in the future (Figure 3).
Figure 2: Population Three broad age groups (2022) for Rother (LGInform, 2024)
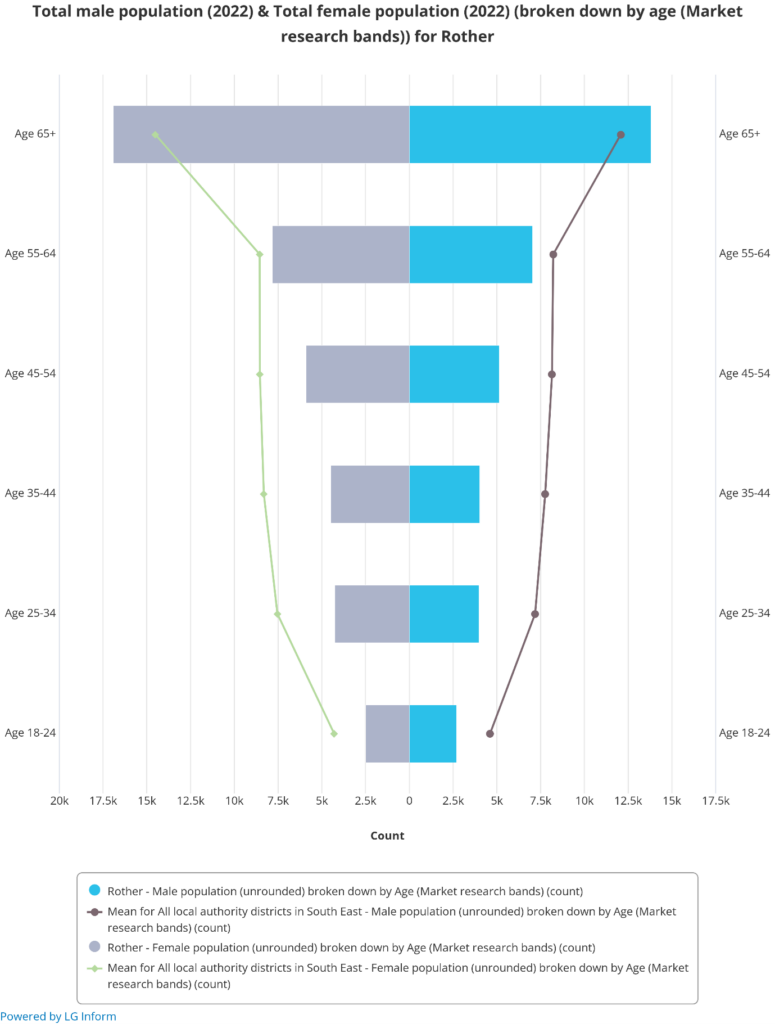
Figure 3: Total Male and Female Population (2022) by age (market research bands) for Rother (LGInform, 2024)
Life Expectancy
The life expectancy of someone born today in Rother is 82 years. Split by gender, a girl born today in Rother has a life expectancy of 84 years, and a boy has a life expectancy of 80 years.
In comparison, the life expectancy at birth in England is 81 years, for females, this rises to 83 years and for males, it falls to 79 years.
The life expectancy in Rother has risen by 3 years since the last census, in line with England as a whole.
Ethnicity
According to the 2021 census, the population in Rother is predominantly white (95.6%), with non-white minorities representing the remaining 4.4% of the population. 1.8% of usual residents in Rother identified their ethnic group within the ‘Mixed or Multiple’ category. 561, or 1% of the Rother population, are Black. In England, more broadly the portion of the population that is white is 81%, 10% are Asian and 4% are Black (Figure 4).
Figure 4: Population -Ethnicity (2021) for Rother (LGInform, 2024)
Household Composition
17.1% of Rother households included a couple but no children in 2021, down from 19% in 2011. One person households aged 66 and over account for 19.9% of households, similar to 2011 (Figure 5).
Figure 5: Percentage of households by household composition (ONS, 2024)
Disability
The ‘Equality Act 2010’ defines disability as a ‘physical or mental impairment that has a ‘substantial’ and ‘long term’ negative effect on a person’s ability to do normal daily activities.
In the 2021 Census 7.5% of Rother residents were identified as being disabled and limited a lot. This figure decreased from 8.2 in 2011 (Figure 6)
Figure 6: Percentage of people who identified as being disabled (2021) (ONS, 2024)
Obesity
The proportion of adults classed as overweight or obese in Rother at 64.4% (2021/22) is higher than the Southeast Region at (62.7%) and England (63.8%) averages. Obesity prevalence in year 6 children in Rother at 19.3% (2021/22) is lower than the Southeast region at 20% and England at 23.4% averages ( (Disparities, 2024)
Leading causes of death
Across all ages, dementia is the leading cause of death followed by ischaemic heart diseases. From a premature mortality perspective (deaths under 75 years), the leading cause of death is lung cancer and ischaemic heart disease (JSNA, 2024).
Figure 7: All ages, leading cause of death (number of deaths shown, 2022 (JSNA, 2024)
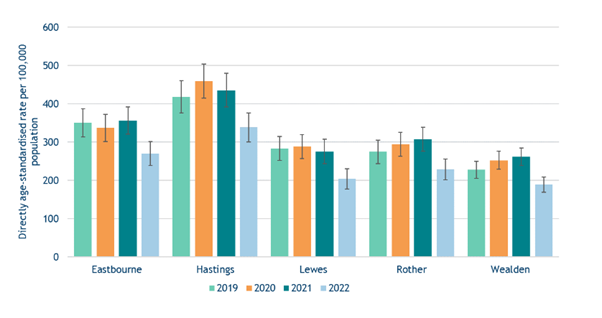
Figure 8: Premature mortality (under 75s) from all causes by district 2019 – 2022 (JSNA, 2024)
Poverty and deprivation
Rother is in the 40% most deprived authorities in England. The 2019 Index of Multiple Deprivation gives an overall rank for Rother of 135 out of 317 English local authorities, with the most deprived local authority ranked as one. Rother has seen a slight improvement in the ranking since 2010, when Rother was higher in the ranking of most deprived local authorities at 132. (MySociety, 2024).
The most deprived areas in Rother are mainly in Bexhill Sidley, Central Bexhill, Eastern Rother, and the northwest of Rye Town (Figure 9).
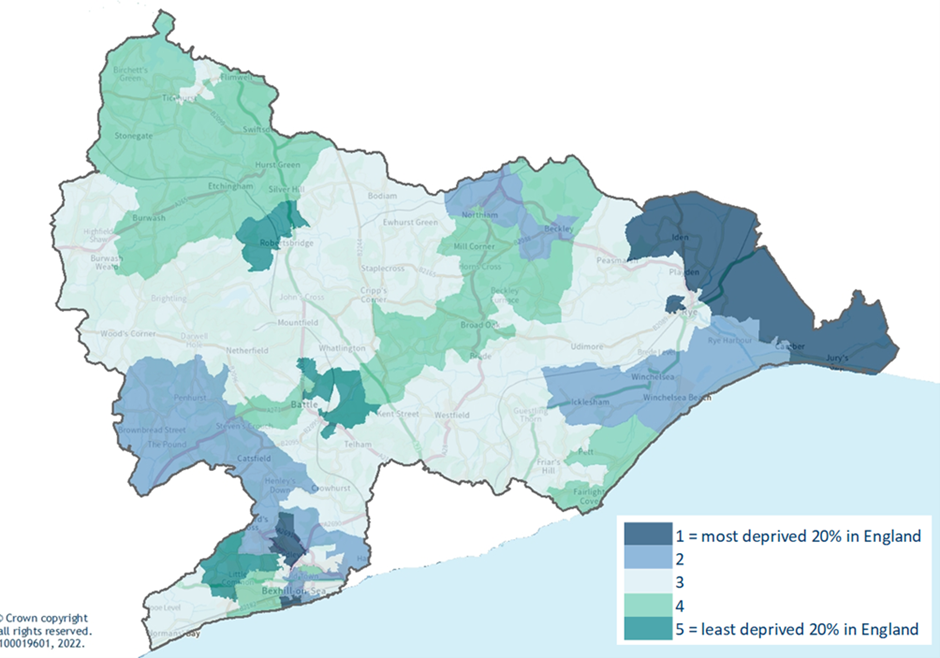
Figure 9: Areas of Deprivation in Rother (MySociety, 2024)
In March 2024, the proportion of residents claiming unemployment related benefits was 3.2%, this is higher when compared to English districts at 2.9% (LGinform, 2024). In quarter 3 of 2023, Rother had 7.9% (6,319 people) of its residents claiming support for Council Tax, compared to the average English districts at 6.5% (6,294 people) (LGinform, 2024).
In Rother, the proportion of children under the age of 16 in relative low-income families (2022/23) was 17.8%, higher than the Southeast region (12.4%) (LGInform, 2024).
Debt is lower in Rother than other English districts. 33% of residents say they have a low level of financial knowledge and 30% have low confidence in managing money (Money and Pensions service, 2022).
Since 2021 (2019 data), the Low Income Low Energy Efficiency (LILEE) indicator considers a household to be fuel poor if: (i) it is living in a property with an energy efficiency rating of band D, E, F or G as determined by the most up-to-date Fuel Poverty Energy Efficiency Rating (FPEER) methodology; and (ii) its disposable income (income after housing costs (AHC) and energy needs) would be below the poverty line.
The percentage of households in fuel poverty in Rother has increased year-on-year since 2020. In 2022 this was 13.1%, with Hastings Borough higher at 16.1% and Wealden District lower at 10.6% (LGInform, 2024) (Figure 10).
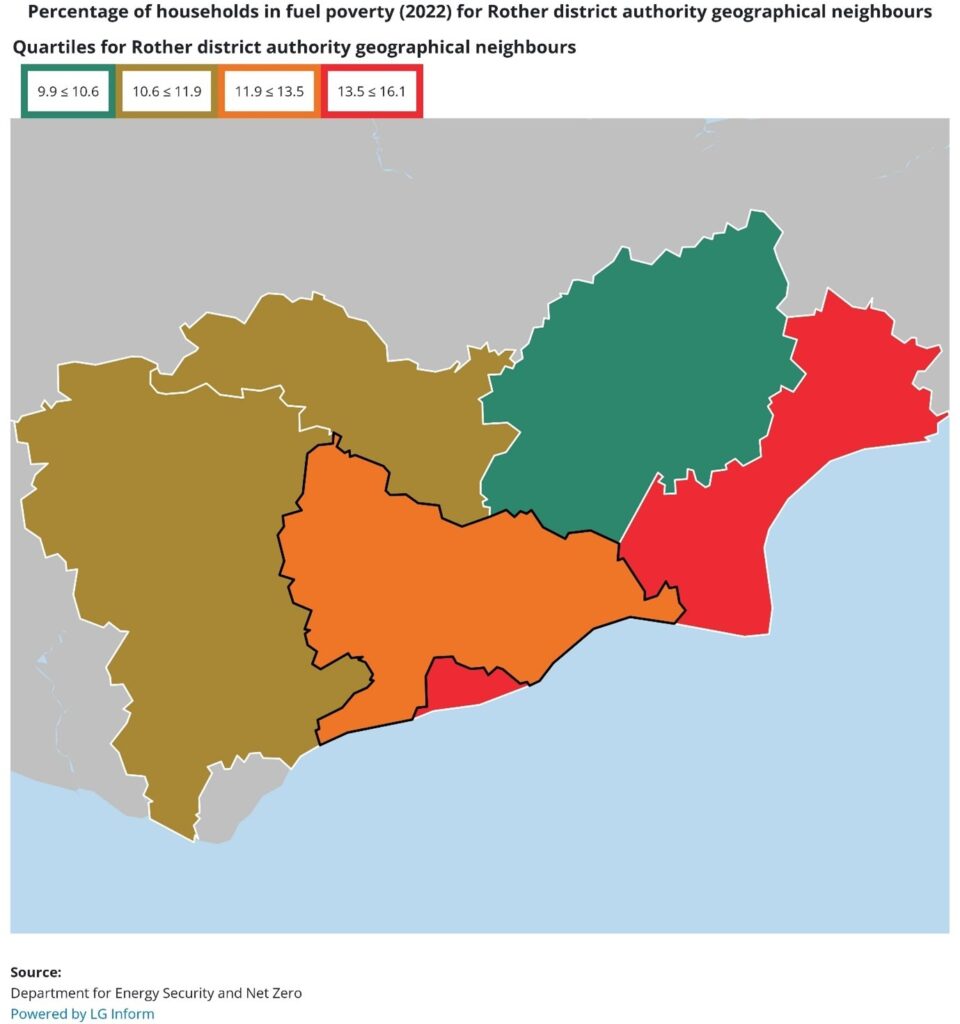
Figure 10: Percentage of households in fuel poverty (2022) (LGInform, 2024)
An average of 36% of assessed homes in Rother have an EPC rating of C or higher. This is below the England (41%) average (ONS 2022). The Government has set a goal for fuel-poor homes (households where the cost of heating is high relative to income In England to reach a rating of C or higher by 2030) (Figure 11). The percentage of homes without an EPC is 35% according to the Government’s EPC register.
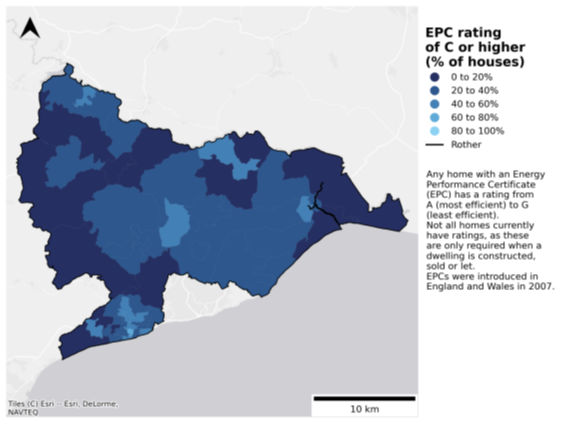
Figure 11: % of houses EPC rating C or higher (ONS, 2022)
Personal Wellbeing
Estimates of personal wellbeing in the UK are published by the ONS annually, with scores for anxiety, happiness, life satisfaction, and feeling like life is worthwhile. Overall scores are based on surveying a representative sample of the population and are scored out of 10 (e.g. for happiness, zero is ‘not at all happy’ and 10 is ‘completely happy’).
Residents report higher average ratings for happiness, life satisfaction and what they do is worthwhile, but higher levels of anxiety compared to other districts (ONS, 2023). Average scores reported for anxiety in Rother were 3.4 in 2023. In the rest of England, levels of Anxiety are scored at 3.2 (Varbes, 2023) (Figures 12 & 13). In 2021/22 the emergency admissions for intentional self-harm per 100,000 individuals is higher (269.3) than regional (197.5) and national (163.9) averages (Disparities, 2024).
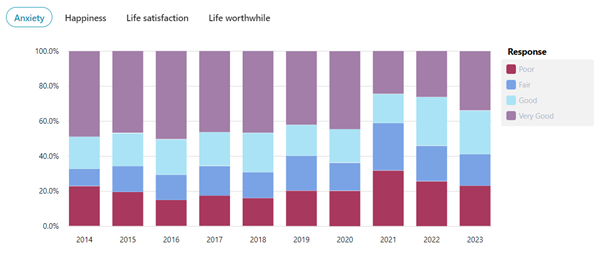
Figure 12: Personal Wellbeing: Anxiety Response 2014 – 2023 (Varbes, 2023)
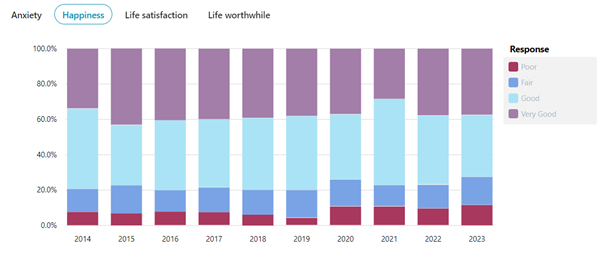
Figure 13: Personal Wellbeing: Happiness Response 2014 – 2023 (Varbes, 2023)
Our Place
Employment
In Rother, the employment rate of the working age population has decreased. In Q1 of 2023 (12 months ending), employment was at a high point of 80%. By Q4 (12 months ending), the overall employment rate was 67.7% ( (LGinform, 2024). The 12 months ending means the rolling average and, as such, these even out any seasonal fluctuations (Figure 14).
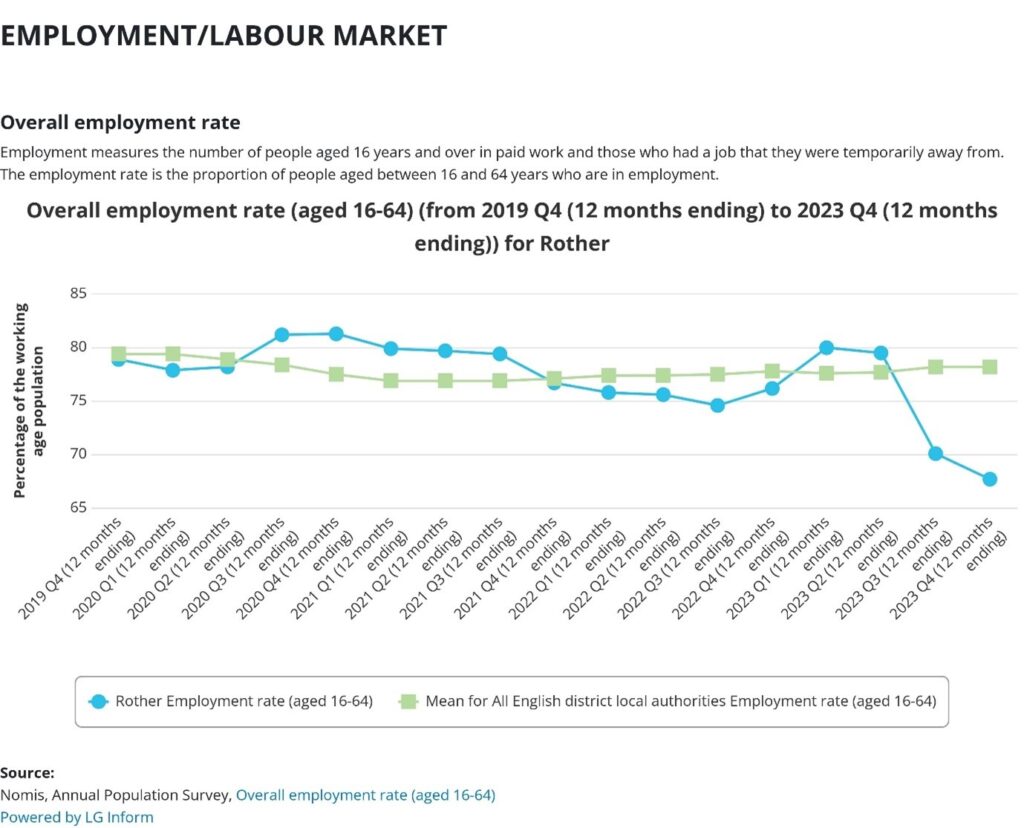
Figure 14: Overall employment rate (aged 16-64) for Rother (LGinform, 2024)
A higher proportion of working age adults in Rother are self-employed (16.8% compared to the national average (11.2%) (Figure 15).
53.9% of employed adults (aged 16-64) in Rother were working full-time (more than 31 hours per week) in 2021. There was a higher percentage of part-time workers in Rother compared to the national average (Figure 16).
Figure 15: Employees and self-employed in 2021 (ESIF, 2024)
Figure 16: Hours worked in 2021 (ESIF, 2024)
Unemployment
Rother has the lowest number of unemployed claimants of Universal Credit (UC) / Job Seekers Allowance (JSA) when compared to neighbouring districts and boroughs. There were 7.4% fewer claimants in November 2023 compared to November 2022 (Figure 17).
| Location | November ’22 | November ’23 | Actual Change | Annual % change |
|---|---|---|---|---|
| Eastbourne | 2,735 | 2,670 | -65 | -2.4% |
| Hastings | 3,060 | 2,855 | -205 | -6.7% |
| Lewes | 1,790 | 1,765 | -25 | -1.4% |
| Rother | 1,685 | 1,560 | -125 | -7.4% |
| Wealden | 1,975 | 1,825 | -150 | -7.6% |
| East Sussex | 11,245 | 10,675 | -570 | -5.1% |
| South East | 159,805 | 165,755 | 5,950 | 3.7% |
| England | 1,298,065 | 1,349,985 | 51,920 | 4.0% |
Figure 17: East Sussex unemployed claimants of UC/JSA (ESIF, 2023)
More than a quarter of the working age population are economically inactive in Rother (Figure 18).
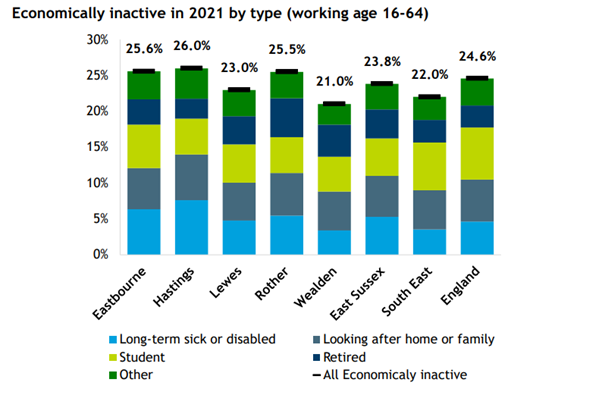
Figure 18: Economically inactive in 2021 by type (ESIF, 2024)
Income
The Annual Survey of Hours and Earnings (ASHE), which is based on a 1% sample of employees, information on whose earnings and hours is obtained from employers.
Median gross annual pay of full-time employees (resident based) – These figures show the median gross annual pay for full-time workers on a resident basis for the area, who are on adults’ rates of pay, and whose pay was not affected by absence. Figures are for GB pounds per annum. Full-time workers are defined as those who work more than 30 paid hours per week or those in teaching professions working 25 paid hours or more per week.
In 2023, Rother’s average salary is £31,019. This is 17.5% lower than England’s average salary of £37,794 (Figure 19).
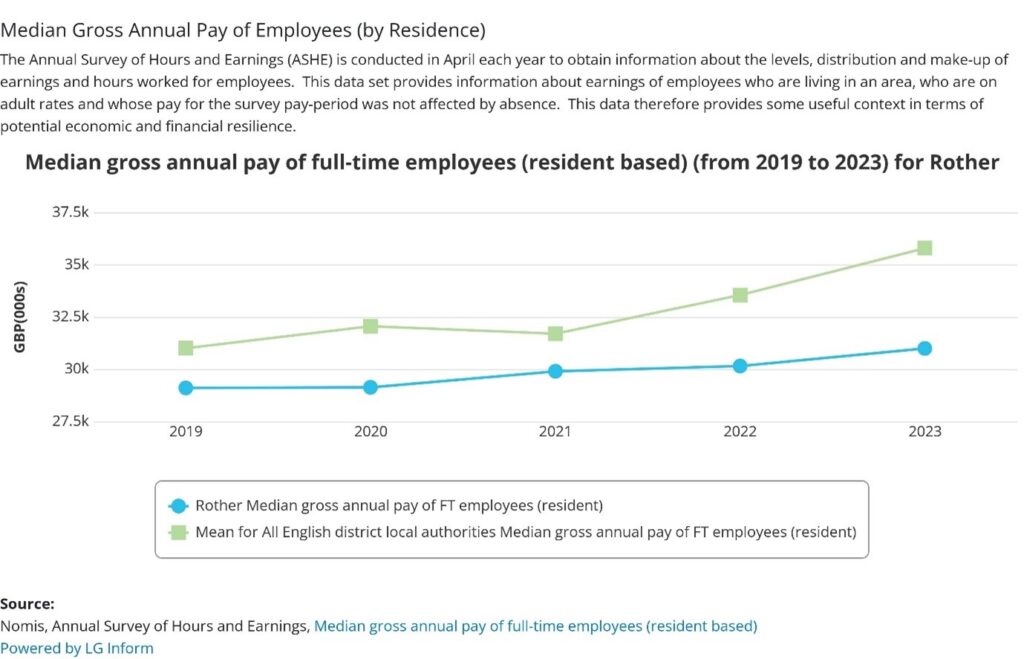
Figure 19: Median gross annual pay of full-time employees 2019 – 2023 (LGinform, 2024)
Qualifications
The Annual Population survey 37.8% of the Rother working age (aged 16-64) population have a degree or higher. This is below the 43.2% degree qualification rate for England. Over 58% of the Rother working-age population have at least 2 A-levels (or equivalent) and 11% have no qualifications. (ONS (2022)) (Figure 20).
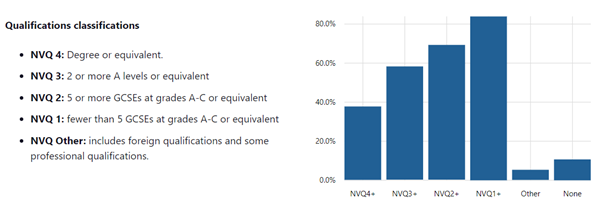
Figure 20: Annual Population Survey 2022 Rother Qualifications (Varbes, 2024)
The Local Economy
Rother has around 4,600 businesses, with small and micro businesses forming a fundamental part of the Rother economy with 88% of businesses in Rother employing less than 9 people.
The UK Business Count data in 2022 published by the ONS show there are 10 large businesses in Rother, making up 0.2% of total businesses. In England, 0.4 of businesses are large. A large business is defined as having over 250 employees.
Of businesses registered within Rother between 2020 and 2023, wholesale and retail trade made up the largest proportion, at 14%. The second largest industry is Construction at 13%. (FAME database, Companies House 2020-23).
The local economy is more dependent on jobs operating in the accommodation and food services and financial and insurance sectors. Other large sectors include agriculture, forestry and fishing, construction, and retail industries. There are fewer jobs within the manufacturing, professional, scientific, and technical industries, business administration and support services (NOMIS: 2021).
1% of total jobs in Rother are in information and communication, one of the key sectors in the future, below the 5% of jobs in England as a whole.
| Industry | Number | Percentage |
|---|---|---|
| Health | 4,500 | 14.8% |
| Accommodation & Food Services | 4,000 | 13.1% |
| Retail | 3,500 | 11.5% |
| Financial & Insurance | 2,500 | 8.2% |
| Education | 2,500 | 8.2% |
Figure 21: Number and % of total jobs by industry 2021 (Varbes, 2024)
There was a 3% increase in roles between 2020 and 2021. In England as a whole, there was a 3% decrease.
The fastest growing industry in Rother is Retail, with jobs in the sector increasing 40% between 2020 and 2021 from 2,500 to 3,500. Healthcare is the fastest growing industry broadly in England.
Agriculture, Forestry, and Fishing saw a 17% decline in the number of roles between 2020 and 2021, from 1,500 to 1,250. In England, the industry with the biggest decline over the same period was Arts, Entertainment, and Recreation, decreasing by 8%.
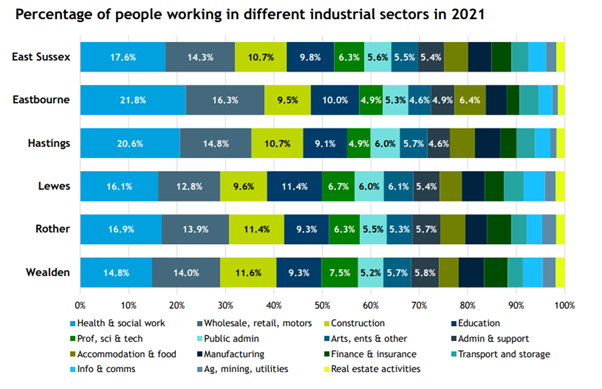
Figure 22: % of people working in different industrial sectors in 2021 (ESIF, 2024)
Tourism
The 2022 Economic Impact Report commissioned by RDC each year from Tourism Southeast notes that 21.6% of the Rother population is employed as a direct result of tourism in the district and £16.8m is spent on average in the local economy every month.
£245.2m is spent in the local area because of tourism. 5.61 million trips are undertaken, the majority day trips (5.21m day trips and 0.40m overnight trips).
Holiday homes
The 2021 Census collated data about the number of people who spend 30 days or more at an alternative address. The total number of holiday homes is likely to be higher, and does not include, for example, Airbnb or other holiday lets in which the owners spend less than 30 days per year.
Rother was home to 38% of all holiday homes in East Sussex, accounting for 44% of all visitors to East Sussex holiday homes. The area around Rye and Winchelsea had the greatest proportion of holiday homes relative to the local housing supply (41.6 holiday homes for every 1,000 dwellings (ESIF, 2023)). Rother ranked 19th in terms of the concentration of holiday homes (13.1 holiday homes per 1,000 dwellings) in all 309 lower tier / unitary authority areas in England (Figure 23).
| Area | Number of holiday homes | Holiday homes per 1,000 dwellings | Number of people spending at least 30 days a year at a holiday home in each area |
|---|---|---|---|
| East Sussex | 1,620 | 6.3 | 4,065 |
| Eastbourne | 365 | 7.4 | 635 |
| Hastings | 300 | 6.8 | 760 |
| Lewes | 130 | 2.8 | 360 |
| Rother | 610 | 13.1 | 1,775 |
| Wealden | 215 | 3.0 | 535 |
| South East | 11,995 | 3.0 | 29,290 |
| Brighton and Hove | 500 | 3.8 | 830 |
| Kent | 2,940 | 4.2 | 7,140 |
| West Sussex | 1,975 | 5.0 | 5,500 |
| England | 61,070 | 2.4 | 171,090 |
Figure 23: Number of holiday Homes (ESIF, 2023)
Housing tenure and affordability
Rother has a much higher proportion of owner occupancy and a much lower proportion of social housing compared to the national, regional, and county averages. According to the 2021 Census, in Rother, 72.7% of households are owner-occupiers (down slightly from 73.5% in 2011). Just one in six households (16.2%) rented privately, compared with 14.0% in 2011. The percentage of Rother households that lived in a socially rented property decreased from 10.4% to 10.2% (Figure 24).
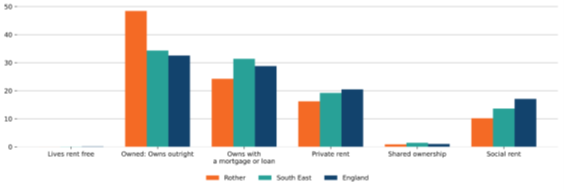
Figure 24: Housing Tenure in Rother (% of households) (ONS, 2023)
The nature of housing tenure in Rother provides challenges in terms of housing and planning policy, meeting an increasing demand with limited supply, particularly supply of affordable housing.
The ratio of median house price to median gross annual workplace-based earnings in Rother has been higher than the England Ratio for the last 12 years. In 2022, that ratio in Rother (12.19) was higher than in the Southeast (10.75) and England (8.28) (Figure 25) This may in part be due to a lower-than-average rate of housing supply growth.
Constrained housing delivery has meant that open market sale house prices have remained resilient, despite challenging economic conditions. There is a strong pipeline of housing in planning consents and site allocations, but these have not translated sufficiently into starts on site.
Where housing is delivered, it is often wholly or significantly of open market sale tenure that does not seek to redress the imbalances set out in the Housing tenure chart above. The implication of this is increasing demand for affordable housing, the impact being housing advice and homelessness services are overstretched and the use of temporary accommodation is increasing
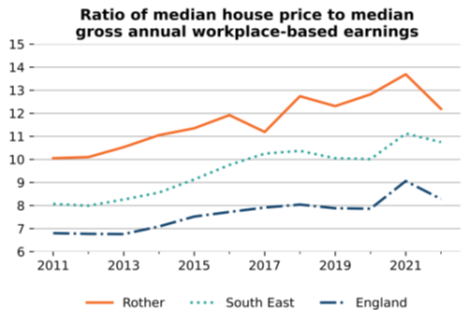
Figure 25: Ratio of median house price (ONS, 2023)
A lower proportion of households in Rother (3.9%) are overcrowded, (those that have an occupancy rating of -1 or less) than in the Southeast (5.6%) and England (6.4%) averages. (ONS Census 2021). For social and rented properties, 12.6% and 8.1% are overcrowded respectively, whereas owned properties are less overcrowded (1.8%) (ONS Census, 2021).
In 2019, the proportion of dwellings that are non-decent, meaning a dwelling does not meet the statutory minimum standard for housing, provide a reasonable degree of thermal comfort, be in a reasonable state of repair, or have reasonably modern facilities and services was higher in Rother (18.3%) that the national rate, excluding London (17.1%) (England Housing Survey, 2023) (Figure 26).
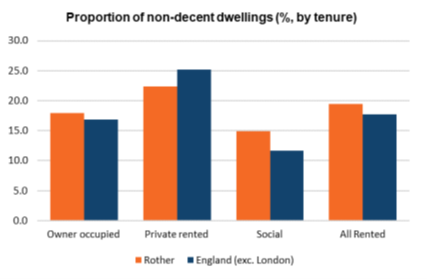
Figure 26: Proportion of non-decent dwellings (% by tenure) (DLUCH, 2023)
Access to Broadband
Broadband access can vary greatly even within small areas, due to infrastructure development and local service providers.
Rother has 51.8% of premises with gigabit capable broadband, lower when compared to the Southeast (72.2%) and England (74.5%) (Source: OFCOM, May 2023).
The outdoor 4G coverage in Rother is 99.7% (OFCOM, April 2023), similar to the levels for the Southeast and England. However, the outdoor 5G coverage in Rother is lower. In April 2023, Rother’s coverage was 54.8%, lower than the Southeast (69.1%) and England (73.9%) (OFCOM, April 2023) (Figure 27).
The availability of broadband, particularly in rural areas, is significant in terms of enabling environmental improvements – benefits may include enabling homeworking, reducing travel to work, and increasing levels of rural businesses.
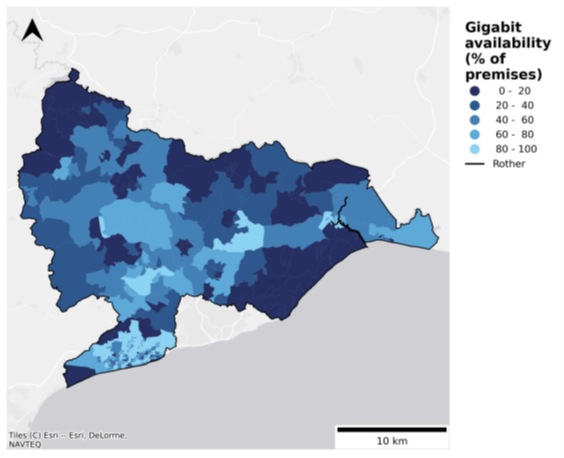
Figure 27: Gigabit availability (% premises) by output area. May 2023 (Ofcom, 2023)
Crime
Rother is the 68th safest, non-metropolitan district in England (of 164 total) when ordered by violent crime rate, and 51st safest when ordered by theft crime rate (2023) (Varbes, 2023).
Neighbourhood crime is defined by the Home Office as domestic burglary, vehicle-related crime, theft from the person and robbery (Home Office, 2020). Neighbourhood crime is covered by the ONS collection of theft offences. This category shows police-recorded theft offences, including burglary, vehicle offences, theft from the person, bicycle theft, shoplifting and all other theft offences.
There were 1,517 incidents reported of theft in Rother to the 12 months ending Q4 2023. An increase of 13.8% (or 184 offences) in the number of theft offences recorded to the same point last year (2022 Q4 (12 months ending)). (LGInform, 2024).
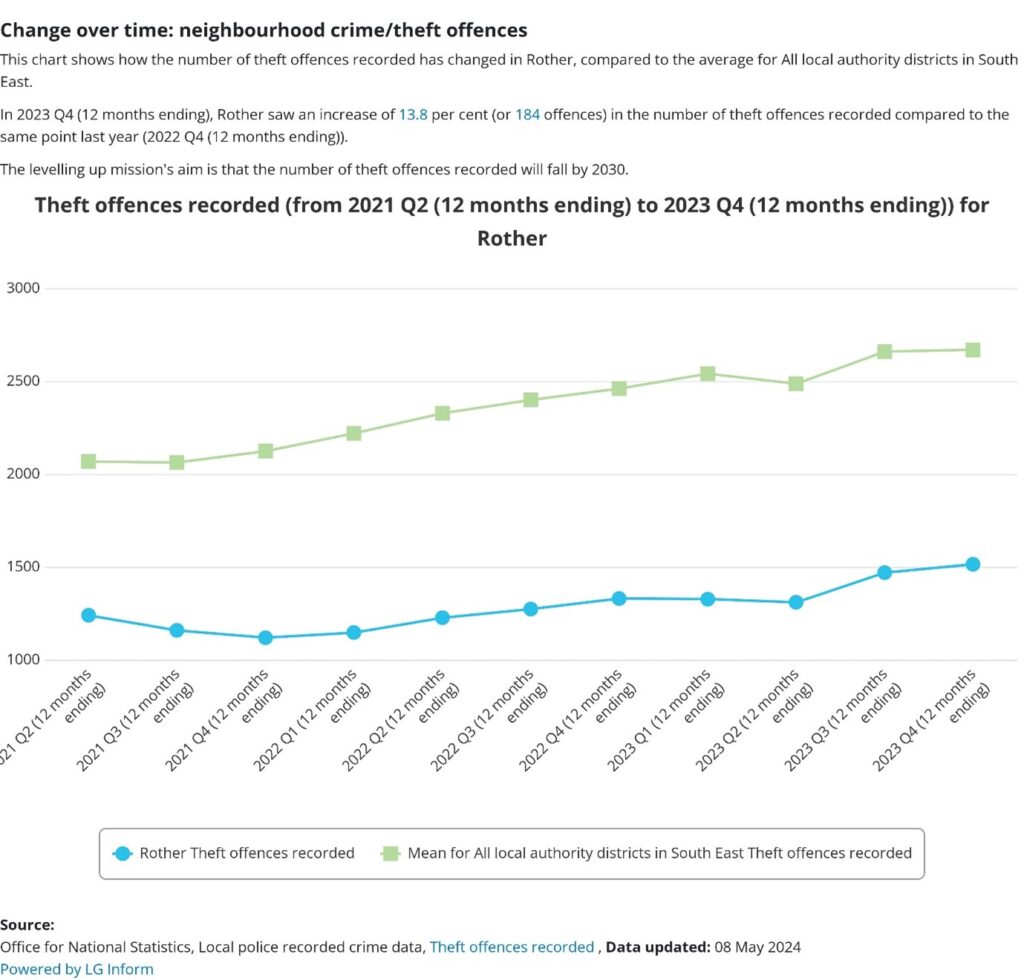
Figure 28: Theft Offences recorded for Rother (LGInform, 2024)
In the twelve months to end of 2023 Q4 (12 months ending), Rother had recorded 62.23 Crimes per 1,000 people. This had increased from 58.66 crimes per 1,000 people in the last equivalent period. The number of recorded offences (excluding fraud) in Rother for the past 12 months was 5,860 crimes (LGInform, 2024).
Top five crimes in Rother in 2023 Q4 (12 months ending) (LGInform, 2024):
- Violence against the person – without injury offences recorded
- Criminal damage and arson offences recorded
- Stalking and harassment offences recorded
- Violence against the person – with injury offences recorded
- Public order offences recorded
Carbon Dioxide Emissions
Emissions have been steadily decreasing across Rother since 2005. This is mostly due to the decarbonisation of the national grid. The Government has set a 2035 target for the national grid to be fossil fuel free.
In 2021, Rother had a carbon footprint of 472.6 ktCO2e, up 15% on 2020 and up 4% on 2019. Emissions have risen between 2020 and 2021 across all parts of the UK and Rother is no exception. This is mainly due to an increase in industrial emissions and post-COVID transport emissions, which have been seen across the county and nationally. Transport emissions have however remained below pre-COVID levels. Industrial emissions have seen a particular increase across the country with 85% of local authorities experiencing an increase. This increase is largely from industrial gas usage. Transport, domestic, and industrial emissions are responsible for 81% of Rother’s emissions (Figure 28)
Figure 29: 2005 – 2021 District Wide GHG Emissions (Council, 2023)
References
Council, R. D., 2023. Rother District Council Climate Strategy. [Online] Available at: https://rdcpublic.blob.core.windows.net/website-uploads/2024/01/Rother_District_Council_Climate_Strategy.pdf [Accessed January 2024].
Disparities, O. f. H. I. &., 2024. Local Authority Health Profiles. [Online] Available at: https://fingertips.phe.org.uk/profile/health-profiles/data [Accessed February 2024].
DLUCH, 2023. English Housing Survey. [Online] Available at: https://www.gov.uk/government/statistics/english-housing-survey-local-authority-housing-stock-condition-modelling-2019 [Accessed Jan 2024].
ESIF, 2023. HOliday Homes in East Sussex in 2021. [Online] Available at: https://www.eastsussexinfigures.org.uk/webview/index.jsp?catalog=https%3A%2F%2Fwww.eastsussexinfigures.org.uk%3A80%2Fobj%2FfCatalog%2FCatalog311&submode=catalog&mode=documentation&top=yes [Accessed April 2024].
ESIF, 2023. Unemployment 2024. [Online] Available at: https://www.eastsussexinfigures.org.uk/webview/index.jsp?catalog=https%3A%2F%2Fwww.eastsussexinfigures.org.uk%3A80%2Fobj%2FfCatalog%2FCatalog311&submode=catalog&mode=documentation&top=yes [Accessed February 2024].
ESIF, 2024. Economic update March 2024. [Online] Available at: https://www.eastsussexinfigures.org.uk/webview/index.jsp?catalog=https%3A%2F%2Fwww.eastsussexinfigures.org.uk%3A80%2Fobj%2FfCatalog%2FCatalog54&submode=catalog&mode=documentation&top=yes [Accessed April 2024].
JSNA, 2024. Rother District Area Profile. [Online] Available at: https://www.eastsussexjsna.org.uk/area-profiles/rother-district-area-profile/#disease_health [Accessed April 2024].
LGInform, 2024. Crime and disorder in ROther, 2023 Q4 (12 months ending). [Online] Available at: https://lginform.local.gov.uk/reports/view/lga-research/lga-research-report-police-recorded-crime?mod-area=E07000064&mod-group=AllDistrictInRegion&mod-type=comparisonGroupType [Accessed May 2024].
LGInform, 2024. Demographic Report for Rother. [Online] Available at: https://lginform.local.gov.uk/reports/view/lga-research/lga-research-report-demographic-report?mod-area=E07000064&mod-group=AllDistrictInRegion&mod-type=comparisonGroupType
LGinform, 2024. Financial hardship and economic vulnerability in Rother. [Online] Available at: https://lginform.local.gov.uk/reports/view/lga-research/ficlga-research-report-financial-hardship-and-economic-vulnerability?mod-area=E07000064&mod-group=AllDistrictsInCountry_England&mod-type=namedComparisonGroup [Accessed May 2024].
LGInform, 2024. Levelling up Missions and Metrics. [Online] Available at: https://lginform.local.gov.uk/reports/view/lga-research/lga-research-report-levelling-up-metrics-in-parent-area-label?mod-area=E07000064&mod-group=AllDistrictInRegion&mod-type=comparisonGroupType [Accessed May 2024].
LGInform, 2024. Levelling Up Missions and Metrics. [Online] Available at: https://lginform.local.gov.uk/reports/view/lga-research/lga-research-report-levelling-up-metrics-in-parent-area-label?mod-area=E07000064&mod-group=AllDistrictInRegion&mod-type=comparisonGroupType [Accessed May 2024].
LGInform, 2024. Percentage of Households in fuel poverty in Rother. [Online] Available at: https://lginform.local.gov.uk/reports/lgastandard?mod-metric=16259&mod-area=E07000064&mod-group=AllDistrictAuthorityGeographicalNeighbours&mod-type=comparisonGroupType&mod-period=3 [Accessed April 2024].
LGInform, 2024. Proportion of children aged 0-15 in relative low income families in Rother. [Online] Available at: https://lginform.local.gov.uk/reports/lgastandard?mod-metric=15369&mod-area=E07000064&mod-group=AllDistrictInRegion_SouthEast&mod-type=namedComparisonGroup [Accessed May 2024].
MySociety, 2024. IMD2019 (Local authorities). [Online] Available at: https://research.mysociety.org/sites/imd2019/area/la-rother-district-council/lsoa/ [Accessed Feb 2024].
Ofcom, 2023. Connected Nations Update. [Online] Available at: https://www.ofcom.org.uk/research-and-data/multi-sector-research/infrastructure-research/summer-2023 [Accessed March 2024].
ONS, 2022. [Online] Available at: https://www.ons.gov.uk/peoplepopulationandcommunity/housing/articles/ageofthepropertyisthebiggestsinglefactorinenergyefficiencyofhomes/2021-11-01 [Accessed FEB 2024].
ONS, 2023. House Price to workplace-based earnings ration. [Online] Available at: https://www.ons.gov.uk/peoplepopulationandcommunity/housing/datasets/ratioofhousepricetoworkplacebasedearningslowerquartileandmedian
[Accessed Jan 2024].
ONS, 2023. Personal Wellbeing in the UK: April 2022 to March 2023. [Online] Available at: https://www.ons.gov.uk/peoplepopulationandcommunity/wellbeing/bulletins/measuringnationalwellbeing/april2022tomarch2023 [Accessed Jan 2024].
ONS, 2023. Tenure. [Online] Available at: https://www.ons.gov.uk/datasets/TS054/editions/2021/versions/4 [Accessed January 2024].
ONS, 2024. How life has changed in Rother: Census 2021. [Online] Available at: https://www.ons.gov.uk/visualisations/censusareachanges/E07000064/
Varbes, 2023. Crime in Rother. [Online] Available at: https://www.varbes.com/crime/rother-crime [Accessed May 2024].
Varbes, 2023. Demographics of Rother. [Online] Available at: https://www.varbes.com/demographics/rother-demographics [Accessed March 2024].
Varbes, 2024. Economy of Rother. [Online] Available at: https://www.varbes.com/economy/rother-economy [Accessed Jan 2024].